Materials
Recently, we have expanded our expertise to the area of measuring thermal transport with two-color time-domain thermoreflectance (TDTR). Thermal management is an ever-increasing necessity for modern technological applications such as nanoelectronic design, thin-film thermal barrier coatings, and thermoelectric materials performance. As engineering considerations of thermal management approach the nanometer-scale regime, complications arise from both the ability to measure thermal transport at such small sizes and the increasingly important capability of effectively separating out thermal interfacial scattering. TDTR is a well-established experimental method for measuring physical properties such as thermal conductivity [1 – 7], interfacial thermal resistance [8, 9], and thermoreflectance coefficients of metals [10]. The technique is an all optical, noncontact, nondestructive method utilizing ultrashort laser pulses that serve two purposes–heating the surface of a sample (pump) and monitoring the time-resolved, temperature-dependent changes in optical reflectivity (probe). Compared to the 3ω method (another commonly employed technique for measuring the thermal properties of thin films), TDTR has the following advantages: 1) direct measurement of electrically conductive materials, 2) easy extraction of interfacial resistances, and 3) nanometer-scale depth resolution.
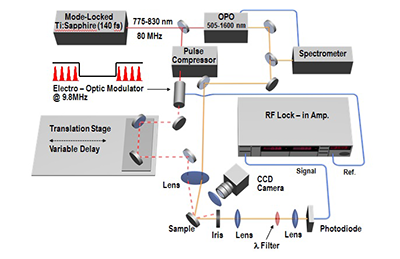
Figure 1. Schematic of the Two-Color TDTR Lab.
A schematic of the experimental arrangement is shown in Figure 1. The output of a mode-locked Ti:sapphire laser is split into a pump and a probe beam. The pump beam is sent first through a pulse compressor (for correction of pulse-stretching effects) and then through an electro-optic modulator (EOM), which imposes a square-wave pulse train with a frequency of 9.8 MHz. The pump beam is then aligned along a mechanical translation stage to systematically alter the timing between the pump and the probe pulses. The probe beam is sent through an OPO for wavelength modification (to be discussed in more detail shortly). Both pump and probe beams also have half-waveplate/polarizer combinations (not shown in Figure 1) for arbitrarily controlling the beam intensity. Both beams are then focused to a spot size of ~ 50 μm diameter at a 45° angle to the sample. The reflected probe beam is spatially filtered, recollimated, and sent through a 750-nm shortpass optical filter to reject scattered pump-beam light (polarization filtering is not required). Finally, the probe beam is passed through a neutral-density filter (optical density = 1.0) and focused onto a silicon (Si) photodiode detector. The output of the detector is sent to the input of a dual-phase, radio-frequency (RF) lock-in amplifier that has its reference channel connected to the same electronic signal that drives the EOM. The scans and data acquisition are computer controlled by means of a home-made LabVIEW program. Prior to data collection, all samples are coated with ~ 100 nm of a thermoreflectance transducer metal.
The OPO employed is based upon collinear, quasi-phase-matched interaction in a periodically poled crystal. The input beam is converted into a signal and idler beam with the wavelength relationship 1/λinput = 1/λsignal + 1/λidler. The input beam is required to be in the range 775 – 830 nm. The output-signal beam (the idler is considered a by-product) is cavity-length tunable in the infrared (IR) range 1000 – 1600 nm. The process is synchronous and jitter-free for generating trains of nearly transform-limited femtosecond pulses. The OPO used here also has a second-harmonic-generation feature for the signal beam, with a temperature-tuned lithium triborate (LiB3O5, or LBO) crystal. The output in this configuration is within the visible-wavelength range 505 – 750 nm. Piezo-actuated stabilization of the cavity length (OPO-wavelength output) is achieved through a feedback loop that involves an external spectrometer. Changing among the wavelength settings can be achieved in ~ 1 hr. The OPO is also slowly purged with dry-nitrogen (N2) gas to ensure that the optics are clean, prevent strong IR absorption from water, and promote the lifetime of the hygroscopic LBO crystal. The lab also has the flexibility to rapidly convert to a single-color TDTR arrangement through the use of a flip-mounted mirror that is placed directly in front of the OPO. The separate optical path for the one-color probe beam is similar to that illustrated for the OPO output in Figure 1 (not including the spectrometer). However, the short-pass optical filter used in the two-color scheme must then be replaced by a polarizer.
Analysis of raw TDTR data for extraction of thermal properties is accomplished with a frequency-domain model [11] in which the ratio of the in-phase and out-of-phase lock-in amplifier signals is calculated as a function of time:
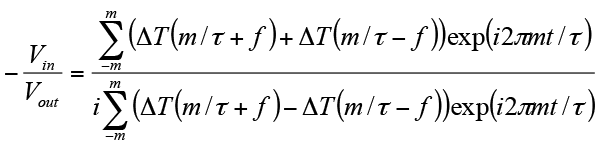
Here m is an integer denoting summation over pump pulses, τ the time between unmodulated laser pulses (12.5 ns), f the modulation frequency (9.8 MHz), and t the time delay between pump and probe pulses. The function ΔT is calculated with the Feldman matrix algorithm as explained in Ref. 11 (Eq. (1) is also multiplied by a phase shift of ei2πft). Data for pump advance times earlier than t = 100 ps are not taken into account since electron-phonon coupling has not equilibrated, which allows the metal transducer film to reach a uniform temperature. Picosecond acoustics also perturb this regime (which facilitates direct measurements of the metal thickness). For thin-film samples, thicknesses must be known if they are comparable to the thermal penetration depth of the experiment . Here D is the thermal diffusivity of the sample layer and f is the TDTR modulation frequency. Data analysis is performed with a nonlinear least squares application to Eq. (1). The only unknown variables are the interface thermal conductance (between the metal transducer and the sample layer) and the sample layer thermal conductivity, and these parameters can be simultaneously determined. Shown in Figure 2 are example raw data and modeled data for a sample consisting of Ta metal deposited on highly-ordered pyrolytic graphite. The inset shows acoustic echo determination of the Ta film thickness.
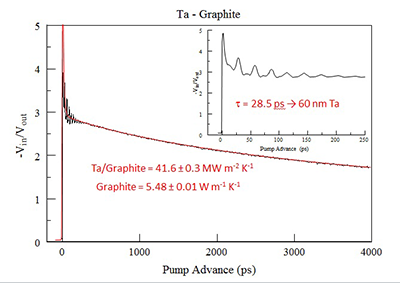
Fig. 2. Example TDTR raw data and modeled data for a Ta-graphite sample.
References
[1] J.J. Gengler, C. Muratore, A.K. Roy, J. Hu, A.A. Voevodin, S. Roy, and J.R. Gord “Yttria-Stabilized Zirconia-Based Composites with Adaptive Thermal Conductivity” Compos. Sci. Technol. 70 2177 – 2122 (2010).
[2] J.J. Gengler, J. Hu, J.G. Jones, A.A. Voevodin, P. Steidl, and J. Vlček “Thermal Conductivity of High-Temperature Si-B-C-N Thin Films” Surf. Coat. Technol. 206 2030 – 2033 (2011).
[3] M.H. Check, D.S. Dudis, J.B. Ferguson, J.J. Gengler, H.A. Seibel II, B.C. Elliott, Z.S. Votaw, and A.A. Voevodin “Synthesis of Zinc Fulleride (ZnxC60) Thin Films with Ultra-Low Thermal Conductivity” J. Appl. Phys. 110 124320 (2011).
[4] C.V. Ramana, M.N.-A. Alam, J.J. Gengler, and J.G. Jones “Growth, Structure, and Thermal Conductivity of Yttria-Stabilized Hafnia Thin Films” ACS Appl. Mater. Interfaces 4 200 – 204 (2012).
[5] R. Rachbauer, J.J. Gengler, A.A. Voevodin, K. Resch, and P.H. Mayrhofer “Temperature Driven Evolution of Thermal, Electrical, and Optical Properties of Ti-Al-N Coatings” Acta Materiala 60 2091 – 2096 (2012).
[6] C.V. Ramana, J.J. Gengler, and J.G. Jones “Crystal Structure, Phase Analysis, and Thermal Conductivity of Nanocrystalline Gd2O3-HfO2 Coatings” J. Phys. Chem. C 116 25178 – 25183 (2012).
[7] C. Muratore, V. Varshney, J.J. Gengler, J.J. Hu, J.E. Bultman, T.M. Smith, P.J. Shamberger, B. Qiu, X. Ruan, A.K. Roy, and A.A. Voevodin “Cross-Plane Thermal Properties of Transition Metal Dichalcogenides” Appl. Phys. Lett. 102 081604 (2013).
[8] J.J. Gengler, S.V. Shenogin, J.E. Bultman, A.K. Roy, A.A. Voevodin, and C. Muratore “Limited Thermal Conductance of Metal-Carbon Interfaces” J. Appl. Phys. 112 094904 (2012).
[9] S. Shenogin, J. Gengler, A. Roy, A.A. Voevodin, and C. Muratore “Molecular Dynamics Studies of Thermal Boundary Resistance at Carbon-Metal Interfaces” Scripta Materiala 69 100 – 103 (2013).
[10] J.J. Gengler, S. Roy, J.G. Jones, and J.R. Gord “Two-Color Time-Domain Thermoreflectance of Various Metal Transducers with an Optical Parametric Oscillator” Meas. Sci. Technol. 23 055205 (2012).
[11] D.G. Cahill “Analysis of Heat Flow in Layered Structures for Time-Domain Thermoreflectance” Rev. Sci. Instrum. 75 5119 – 5122 (2004).